RAWALPINDI BOARD 2014
PAPER STATISTICS PART-2
Time: 20 Minutes
(Objective Part)
Marks:17
Note: Four Answers are given against each column A,B,C&D, Select the write answer and only separate answer sheet, fill the circle A,B,C or D with pen or marker in front of that question number.
- For normal data, number of observations in mean ± standard deviation is.
(A) 68.3%
(B)
(C)
(D)
- Number of parameters of normal distribution is:
(A) 2
(B)
(C)
(D)
- Coefficient of skewness, β1 for normal distribution is
(A) 0
(B)
(C)
(D)
- In sampling without replacement.
(A) = 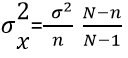
(B)
(C)
(D)
- Z =
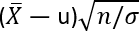 for large n follows;
(A) Normal
(B)
(C)
(D)
- Total number of possible samples with N = 2, n = 3 with replacement is:
(A) 8
(B)
(C)
(D)
- Point estimate of population mean is:
(A) 
(B)
(C)
(D)
- An estimator
 is unbiased estimates of θ , if:
(A) 
(B)
(C)
(D)
- An estimator of θ has bias equal to
(A) E() + θ
(B) E() - θ
(C) E()
(D) θ
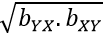
- If bYX=0.9, bxy = 0.4 then correlation coefficient is.
(A) 0.4
(B) 0.9
(C) 0.36
(D) 0.036
 is called:
(A) GM
(B)
(C)
(D)
- Correlation coefficient is calculated between two variables which are both:
(A) Quantitative
(B)
(C)
(D)
- Degrees of freedom for chi-square is:
(A) (r — 1) (c — 1)
(B)
(C)
(D)
- Possible values of a chi-square statistic are:
(A) ≥
(B)
(C)
(D)
- Number components of a time series are:
(A) 4
(B)
(C)
(D)
- Number of phases of a cyclical fluctuation is:
(A) 4
(B)
(C)
(D)
- Which of the following is not a hardware?
(A) Main memory/Excel
(B)
(C)
(D)
Time: 2:40 Hours
Subjective Part
Marks:68
SECTION-I
2. Write short answers of any Eight Parts. 16
- In a normal distribution the mean is 20 and standard deviation is 5. Write down its equation. Find the value of maximum ordinate.
- The mean wages of workers is normally distributed µ= 285R.S and σ= 50R.S. Find the percentage of workers who get P(X>7200)
- What is normal distribution?
- Write the equation of the standard normal distribution?
- What are the special areas under the normal curve?
- Write the desirable properties of a good estimator?
- Define the term unbiasedness?
- How can you define precision of estimate?
- What is critical region and acceptance region?
- What is test of significant?
- What are types of computers?
- Distinguish between input and output devices?
3. Write short answers. (any eight)
- Given N = 300, n= 100, and σ2 = 200. If sampling is done with replacement then find σ 2/x
- If x = 9.2, Y = 16.5 and byx = 0.64, then find the regression line "Y" on 'X'
- Define the random sampling?
- Define the standard error?
- Define the stratified random sampling?
- Given n = 5, P = 0.5. Find the value of

- Write down the basic aims of sampling?
- What is meant by regression?
- Define correlation?
- Write a short note on scatter diagram.
- Given Syx 20,Sy=8 and Sx = 6. Compute rxy
- Write any three properties of regression coefficient?
4. Write short answer. (any six)
- What is an attribute?
- Define a contingency table?
- What is perfect positive association?
- What is time series?
- What are the main components of time series?
- Define Historigram?
- What is meant by decomposition of a time series?
- Define the cyclical movement?
- Give the normal equations of second degree prabola?
Attempt any three questions.
Question#5
(a) In a normal distribution the lower and upper quartiles are 15 and 25 respectively Find mean, median, mode and standard deviation?
(b) The diameters of eggs of the little bird are normally distributed with mean 4.11cm and standard deviation 0.19cm. Calculate the probability that an egg chosen at random has adiameter between 3 9cm and 4 5cm?
Question#6
(a) If the size of the simple random sample from an infinite population is 55, the variance of sample mean is 27. What must be the standard error of sample mean, if n= 165?
(b) Draw all possible samples of size 2 at random without replacement from the population 1,2,3, 4 and 5. Find the proportion of even numbers in the samples. Form the sampling distribution of the sample proportion "P" and verify that.
i) µ=11
ii) =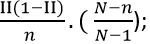
where: P = Sample proportion, II = Population proportion.
Question#7
(a) From the following construct 99% confidence Interval for µ1-µ2. n1=40,Σfx1=807,  =16329,n2 = 50,Σfx2 =972,
  =19177
(b) An electric company claimed that at least 85% of the parts which they supply conformtothe specification. A sample of 400 parts was tested and 75 did not meet specifications.Can we accept the company's claim at α= 0.05
Question#8
(a) For a data given below, find the regression equation of Y on X and estimate the value of "Y" if X = 12?
|
X |
3 |
7 |
5 |
4 |
3 |
9 |
Y |
8 |
3 |
2 |
2 |
3 |
7 |
(b) From the follwoing table, calculate Karal Pearson coefficient of correlation?
|
X |
6 |
2 |
10 |
4 |
8 |
Y |
9 |
11 |
5 |
8 |
7 |
Question#9
(a) Find the co-efficient of association from the values Height of Fathers
| Height of Sons |
Tall |
Short |
| Tall |
500 |
100 |
| Short |
100 |
400 |
(b) Find secularrend by semi-average method for the follwoing timeseries.
|
Years |
1975 |
1976 |
1977 |
1978 |
1979 |
1980 |
1981 |
1982 |
1983 |
Values |
100 |
140 |
168 |
120 |
200 |
210 |
170 |
220 |
200 |
Section — Ill
(Practical)
Answer any three parts.
Question#10
(A) A random sample of size n1 = 2 with replacement is drawn from population of 4,8. Another random sample of size n2 =2with replcement is drawn from another population 8,16. Form a sampling distribution of and show that
  =µ2-µ1
(B) Compute co-efficient of correlation and regression co-efficient from the given dat(A)
|
X |
21 |
22 |
23 |
24 |
25 |
28 |
Y |
25 |
24 |
23 |
22 |
26 |
27 |
(C) In 40 tosses of a coin, 24 heads were obtaine(D) Test that coin is biased at %% level of significance, Also find 98% confidence limits for the proportion of heads.
fi0.
(D) Test the independence between gender and using cell phone from the following dat(A) Use α = 0.05
|
Male |
Female |
Use Cell Phone |
80 |
80 |
Don’t Use Cell Phone |
20 |
20 |
(E) Fit a second degree parabola to the following results for the years 1990-1997 both inclusive.
∑x=∑x 3=0, ∑Y = 220, ∑XY= 588,
∑x2=168, ∑x2Y=5299, ∑X4 = 6216