SARGODHA BOARD 2016
PAPER STATISTICS
PART-II
Time: 20 Minutes
(Objective Part)
Marks: 17
Note: Four Answers are given against each column A,B,C&D. Select the write answer and only separet answer sheet, fill the circle A,B,C or D with pen or marker in front of that question number.
Question#1
- In a normal distribution p =10 , a2 = 25 , the diode is:
(a) 5
(b) 10
(c) 25
(d) 250
- The range of the normal distribution is:
(a) 0 to 
(b) 0 to n
(c) -co to 
(d) None
- In a normal distribution µ3 is always:
(a) < 0
(b) > 0
(c) 0
(d) None
- In an infinite population µ = 50
 2 = 250, n = 25 then variance (
 ) is:
) is:
(a) 10
(b) 50
(c) 2.5
(d) None
- A population consists of 1, 2, 3, 4, 5 then the proportion of even numbers in the Population is:
(a) 
(b) 
(c) 
(d) None
- The mean of the sampling distribution of sample mean (µ
 ) is equal to:
(a) 
(b) µ
(c) π.
(d) None
- The coefficient of correlation (r) always lies between:
(a) -1 to 0
(b) 0 to -1
(c) -1 to +1
(d) None
- If byx = -1 , bxy = -1 , then ryx is:
(a) +1
(b) -1
(c) 0
(d) 0.5
- If byx is positive, then rxy will be:
(a) Negative
(b) Positive
(c) 0
(d) None
- A single value used to estimate the population parameter is called:
(a) Level of significance
(b) Point estimate
(c) Interval estimate
(d) None
- The hypothesis which completely specifies the values of the parameters is called:
(a) Null
(b) Simple
(c) Alternative
(d) Composite
- A Null hypothesis alwyas contains:
(a) Equality sign
(b) Inequality sign
(c) No sign
(d) None
- The value of λ2 may be:
(a) -5
(b) -3
(c) -1
(d) >0
- For two independent attributes, the value of coefficient of association (Q) is:
(a) +1
(b) -1
(c) Zero
(d) 2
- Decomposition of time series is called':
(a) Time series
(b) Analysis of time series
(c) Detrending
(d) None
- If a straight'line is fitted to time series, then:
(a) ∑y = ∑y
(b) ∑y<∑
(c) ∑y>∑
(d) None
- One byte equals:
(a) 8 bits
(b) 4 bits
(c) 6 bits
(d) 12 bits
Time: 2:40 Hours
(Subjective Part)
Marks: 68
SECTION-I
2. Write short answers of any Eight Parts. 16
- Write down any two properties of Normal Distribution.
- Explain why β1 equal to zero for normal distribution.
- M.D = 16 Find the value of standard deviation.
- The value of pµ2 = 4 Find µ3 and µ4 about Mean for normal distribution.
- In a standard normal distribution what is the value of mode and median?
- What is meant by unbiasedness?Identify. the estimator and Estimate if a sample of 11 cricket players give an average score of 23.
- What is meant by Estimation?
- Explain difference between one tail test and two tail test.
- What is level of significance?
- Write the names of output devices.
- What is computer?
3. Write short answers of any Eight Parts. 16
- Differentiate between parameter and statistics.
- What is sample design?
- What is meant by probability sampling?
- Define sampling distribution.
- Differentiate between sampling error and non - sampling error.
- Define standard error.
- Write down the properties of r.
If byx = -1.6 and bxy = -0.4 Find the value of r.
- Define the term BIAS.
- Differentiate between regression and correlation.
- What is meant by Scatter diagram?
- Given Sxy = 72, Sx = 4 and. Sy = 18. Find the value of ryx.
4. Write short answers of any Six Parts. 12
- Define contigency table.
- Expalind the term attribute.
- If N = 1000, (A) = 400, Find (α) .
- What is meant by signal in time series?
- Give any two examples of secular trend.
- What is meant by seasonal trend?
- Define noise in time series.
- Calculate three-values moving average for 206, 209, 212, 215,
218, 221.
- In a time series
 = 80+5y. Find intercept and slope of the series.
SECTION -II
Attempt any THREE questions. Each questions carries 8 marks.
Question#5
(a) In a normal distribution the mean is 5 and variance 1. Write down its equation. Also find the value of maximum ordinate.
(b) If X  N (24,16) , then find the 33rd percentile and 9th decile.
Question#6
(a) A population consists of value 10, 20 , 30 , 4o and 50. Form sampling distribution of sample mean when sample size n = 3 are drawn and sampling is done without replacement.
(b) Find mean and variance of sampling distribution formed in part (A) of the question and verify the relation.
Question#7
(a) A random sample of 75 student is selected and 16 are found to have cars on campus. Use 95% confidence interval to estimate the fraction of student who have cars on campus.
(b) The heights of college male students are known to be normally distributed with a mean of 67.39 inches and  = 1.30 inches. A random sample of 400 students showed a mean height of 67.47 inches. Using a 0.05 level of significance. Test the hypothesis Hₒ = µ = 6739 and H1= µ > 67.39 .
Question#8
(a) Regression line "Y on X" is 3X = 43 - 
Regression line "X on Y" is
42Y = 2- 
Identify the two regression coefficients.
(b) Compute coefficient of correlation (ruv)
u=x-25/5, v= Y-10/2
| X |
725 |
730 |
735 |
740 |
745 |
750 |
Y |
916 |
912 |
918 |
920 |
910 |
914 |
Question#9
(a) An investigation into color-blindness and sex of a person gave the following results.
Color blindness
| Sex |
Color blind |
Not color blind |
Male |
36 |
964 |
Female |
19 |
981 |
Is there evidence at the 5% level, of significance and association between the sex of a person and whether or not they are color blind?
(b) For the following data compute 4-year centred moving avera es.
Year |
1981 |
1982 |
1983 |
1984 |
1985 |
1986 |
1987 |
1988 |
1989 |
1990 |
1991 |
Production |
50 |
36.5 |
43 |
44.5 |
38.9 |
38.1 |
38.7 |
32.6 |
41.1 |
41.7 |
33.8 |
SECTION-III(Practical Part)
Note: Attempt any THREE questions.10.
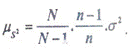
(A) Take all possible samples of size 3 without replacement from a population: 1, 2, 3 , 4. Make a sampling distribution of sample variance, 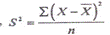 and show that
(B) Take all possible samples of size 3 without replacement from apopulation: 1, 2, 3, 4. Show that sample proportion is an unbiased of the population proportion is an unbiased estimator of the population proportion.
(C) Given the data
Fertilizer |
100 |
200 |
400 |
500 |
Production |
70 |
75 |
80 |
90 |
Find estimated regression line of production on Fertilizer.
Estimate production when fertilizers is 450.
Judge X |
6.8 |
7.3 |
8.1 |
9.8 |
7.1 |
Judge Y |
7.8 |
9.4 |
7.9 |
9.6 |
8.9 |
Calculate coefficient of rank correlation by pear man's tonne a.
Also comment your answer.
Year |
1973 |
1974 |
1975 |
1976 |
1977 |
Y |
42 |
38 |
35 |
32 |
24 |
Find the equation of the semi-averages trend line. Compute out e trend values. Estimate the number of books sold (y) for the year 1980.